Dependency Viewer Actions and Interactions
In [ca5d7e]:
from IPython.display import Image
Image:
IPython.core.display.Image
Graph Updates
To best describe what happens when a graph updates we must first open the dependency viewer.
In [ea1465]:
DepViewerOpen = Image(url='https://rawgit.com/colinjbrown/dfkernel/documentation-update/docs/tutorial/img/cell_toolbar.png')
DepViewerOpen:

Once our viewer is open we can execute code to create some nodes. #### Note: The viewer does not have to be open, changes that happen while the viewer is not open will be rendered upon opening of the viewer.
In [b89f91]:
a = 3
a:
3
After our cell finishes executing the viewer will now update the graph.
In [e775eb]:
Executeb89f91 = Image(url='https://rawgit.com/colinjbrown/dfkernel/documentation-update/docs/tutorial/img/stage1.svg',width=300)
Executeb89f91:

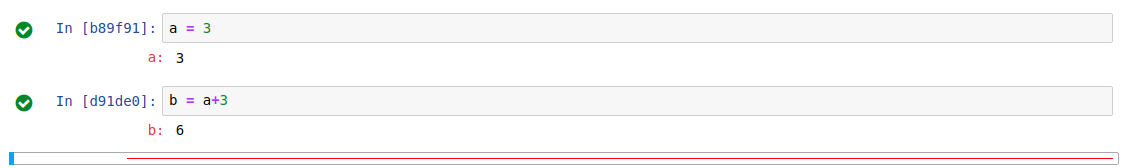
In [d91de0]:
b = a+3
b:
6
When we execute a second cell the viewer will move out and the edge
between a and Cell[d91de0] will be shown.
In [a9ad40]:
Executed91de0 = Image(url='https://rawgit.com/colinjbrown/dfkernel/documentation-update/docs/tutorial/img/stage2.svg',width=500)
Executed91de0:

In [e14d16]:
c = b+5
c:
11
This process then can again be repeated for another cell.
In [d5ce14]:
Executee14d16 = Image(url='https://rawgit.com/colinjbrown/dfkernel/documentation-update/docs/tutorial/img/stage3.svg',width=800)
Executee14d16:

When we decide to delete Cell[b92938] the changes are not rendered
immediatly because the kernel does not know about these changes, instead
we opt to provide a red horizontal cell that acts as a place holder
until that cell is actually removed. Thus inside of the viewer the cell
is also rendered in red.
In [d7faa2]:
Deletee14d16 = Image(url='https://rawgit.com/colinjbrown/dfkernel/documentation-update/docs/tutorial/img/delete_cell.png',width=800)
GraphUpdate = Image(url='https://rawgit.com/colinjbrown/dfkernel/documentation-update/docs/tutorial/img/stage4.svg',width=800)
Deletee14d16,GraphUpdate
Deletee14d16:
GraphUpdate:

When we decide to click on the red bar to undelete the cell the viewer restores the color of that cell to green as if nothing had happened to that cell at all.
In [b782f3]:
Restoree14d16 = Image(url='https://rawgit.com/colinjbrown/dfkernel/documentation-update/docs/tutorial/img/stage3.svg',width=800)
Restoree14d16:
Now we edit In[b89f91] so that instead of a=3 we set a=2,
this results in the graph being updated again.
In [c2ca48]:
Editb89f91 = Image(url='https://rawgit.com/colinjbrown/dfkernel/documentation-update/docs/tutorial/img/stage5.svg',width=800)
Editb89f91:

Toggle Cell Sinks
To be able to demonstrate exactly what this does a more complicated graph needs to be shown, so we will use the graph from a fully executed example of ours that can be found here.
In [a80e4d]:
CellSinksVisible = Image(url='https://cdn.rawgit.com/colinjbrown/dfkernel/documentation-update/docs/tutorial/img/digits-classification-df.svg')
CellSinksVisible:

Upon hitting the toggle to remove cell sinks, we can see that any sink nodes in our graph are now removed and our graph is significantly more compact.
In [e88bb4]:
NoCellSinks = Image(url='https://cdn.rawgit.com/colinjbrown/dfkernel/documentation-update/docs/tutorial/img/digits-classification-df-no-sink.svg')
NoCellSinks:
